- Open Afterglow Access in a separate window and close any open images. You may discard changes. Open the four stacked BVRI images of IC 2948 located in the “Sample > MWU > Module 5 – HR diagrams > IC2948” directory.
- Create a tri-color image of this cluster, as follows:
- Click the Display tool on the right to move out of the Photometry tool.
- Select the B, R and V images from the file list and group them.
- Set your color maps for each image appropriately by right-clicking the image filename (B is blue, V is green, R is red). Zoom to fit.
- Under Color Composite Tools on the right, select Link All Layers (Pixel Value). Then, again under Color Composite Tools, select Photometric Color Calibration, then Measure zero points with field calibration. Leave all the default parameters and click Calibrate Colors once processing is complete.
- Change Stretch Mode to Midtone, then click the Faint Target button. You may adjust your background, midtone and saturation levels to remove any graininess in the image (e.g. in Percentile Mode, try background 6 and midtone 90), but in any case this provides a good sense of what you should expect in terms of age/star formation—i.e. the bok globules and cone nebula indicate there is still ongoing star formation in this region, the emission nebula clearly indicates you should expect some variable extinction/reddening.
- When you are happy with your color image, at the bottom-right click Export Image as JPG to save a copy of the image with colors calibrated using apparent magnitudes.
- Now, open the Clustermancer site. Rather than photometering the images in Afterglow and uploading those data, this time you are going to instead go directly to the catalog data. Under “Look Up a Cluster”, enter “IC 2948” and click the magnifying glass to search up the cluster’s coordinates.
- Click Test Radius to test the default radius value. You should see an error message stating that there are too many stars within the cluster’s radius. Reduce the search radius to 0.12 degrees and test again, then click Next to load the stars within this radius, then Next again to move on to Field Star Removal.
- IC 2948 is located in the Milky Way, so its proper motion is not as well isolated from the rest of the Milky Way field stars as the stars in NGC 3766. However, if you zoom the proper motion ranges towards the centre you should see a denser cluster of stars emerge in proper motion space, at around pmRA = -6 and pmDE = 0.65.
- Once you’ve located the denser patch of stars corresponding to IC 2948, adjust the limits of your PM cut, shrinking the ellipse around the cluster stars.
- Then scroll down and adjust your Distance Range first (in this case, 0-5 kpc works well), and then adjust the Cluster Distance sliders to better isolate the cluster’s main sequence and remove field stars. You may find it helpful to scroll up occasionally and disable Cluster Stars and PM Cut from the proper motion scatter plot, checking that the field stars have fairly uniform proper motion distribution. Eventually, your color-magnitude diagram should look similar to the one in Figure 2.
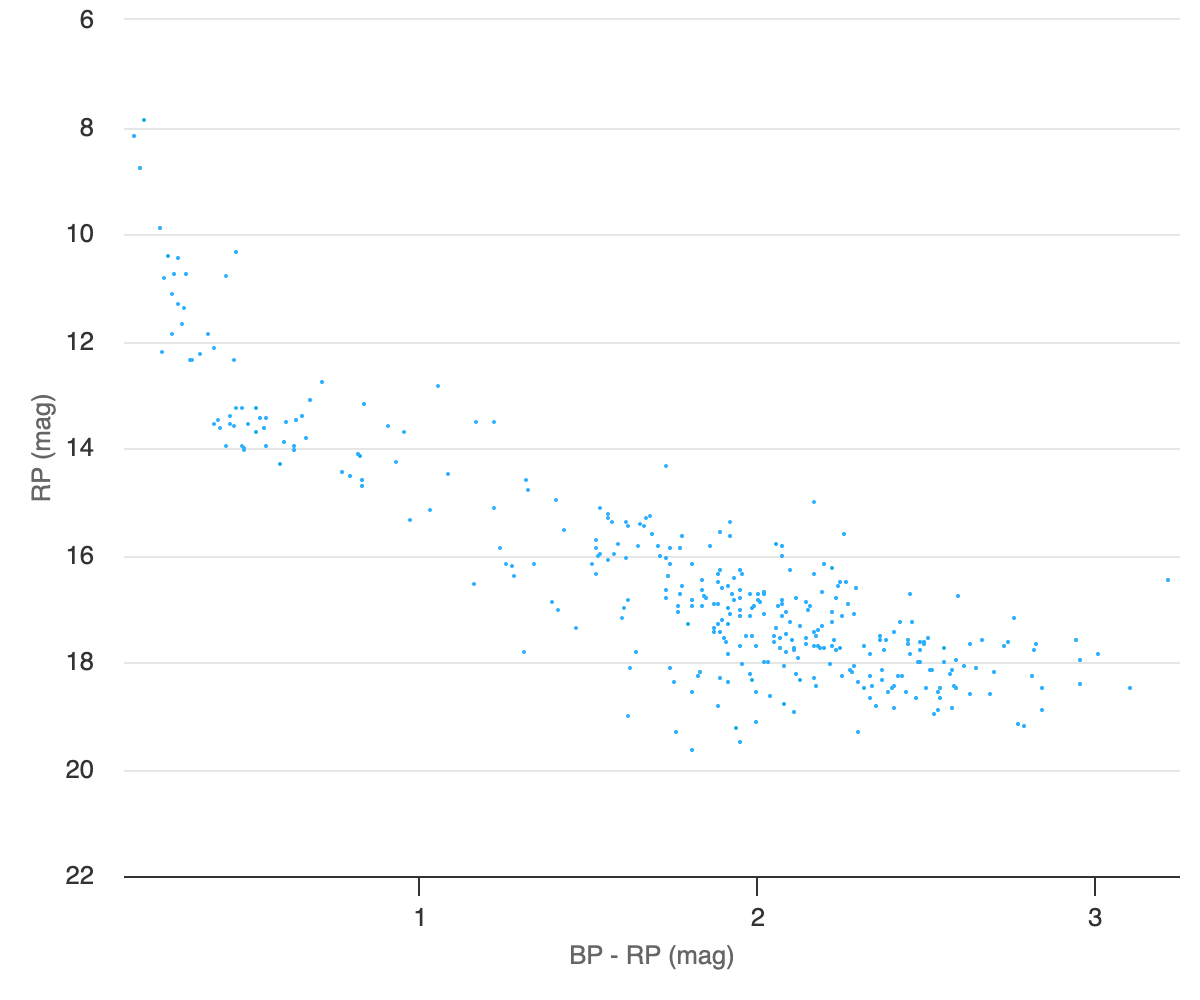
Figure 2: IC 2948 color-magnitude diagram. - Move to Archive Fetching and click Add Catalog Stars. Leave the default radius set to double the catalogued cluster radius, select the Gaia catalog, and then Test Radius.
- If more than 5000 stars fall within your proper motion and distance bounds, return to Field Star Removal and tighten your proper motion and distance constraints.
- If the radius test is successful, click Fetch Data to proceed.
- Return to Field Star Removal and adjust parameters until you are satisfied, then move on to Isochrone Matching. Now, do as follows:
- Create an HR diagram with RP vs BP-RP, and Frame on Data.
- Set Distance to 2.2 kpc, log(Age (yrs)) to 6.75, Metallicity to 0, E(B-V) to 0.34, and Max Error to 0.06. The resulting graph should look similar to Figure 3.
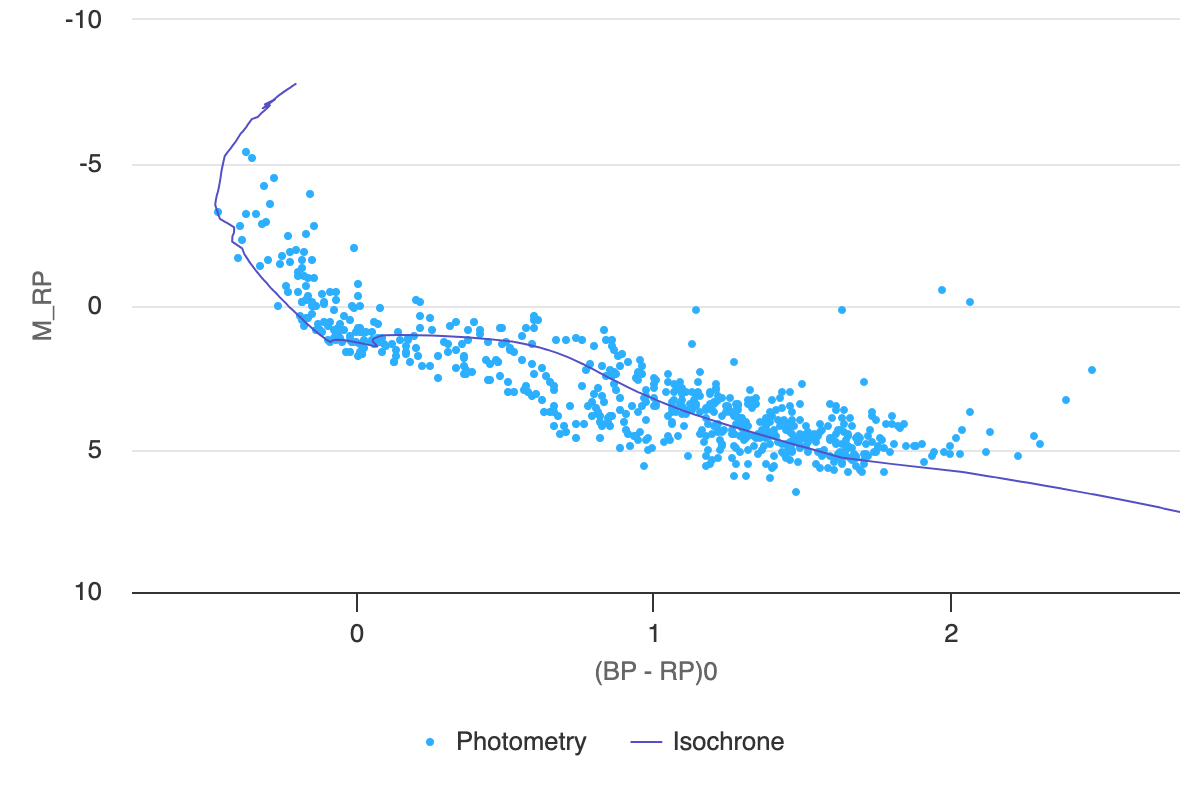
Figure 3: Gaia HR diagram of IC 2948. - Now, decrease log(Age (yrs)) to 6.6, using the down arrow. You should see the isochrone model move up to intersect younger pre-main sequence stars.
- Now, increase log(Age (yrs)) to roughly 8 to identify the oldest stars in this region, which have already settled onto the main sequence. As you do, also keep an eye on the most luminous stars as well, observing that the turnoff point in the isochrone model moves down and crosses through many of these blue giants as the model age increases.
- While the majority of stars in this cluster are still quite young, with ages of approximately 5 million years, this suggests that there has been continuous star formation in the region over ~100 million years.
- Adjust parameters to estimate “best fit” values. When you are satisfied with your model fit, save the graph as a PNG, then move on to the Result Summary page. Click the CSV button at the bottom-left and save a copy of the parameter values you just derived through your analysis.
- Return to Afterglow Access. With the E(B-V) value you estimated, you can now deredden your image of IC 2948. Click Color Composite Tools > Photometric Calibration, and set E(B-V) to 0.34, then click Calibrate Colors. Again, at the bottom-right of the image click Export Image as JPG to save a copy of your dereddened color image.

